The Survivorship Trap: Your Cycle Time Only Counts the Work That Finished
Cycle time is measured on closed work, so the items stuck in Blocked, In Review or QA for weeks never appear in it. In a typical enterprise, the median open item is twice as old as the median closed one, and a third of work in progress is already older than the 85th percentile the dashboard reports. Learn what engineering leaders on Reddit say about green cycle time charts and stuck work, and how Keypup MCP measures the age of open Jira issues, where they sit still and what code is behind them.
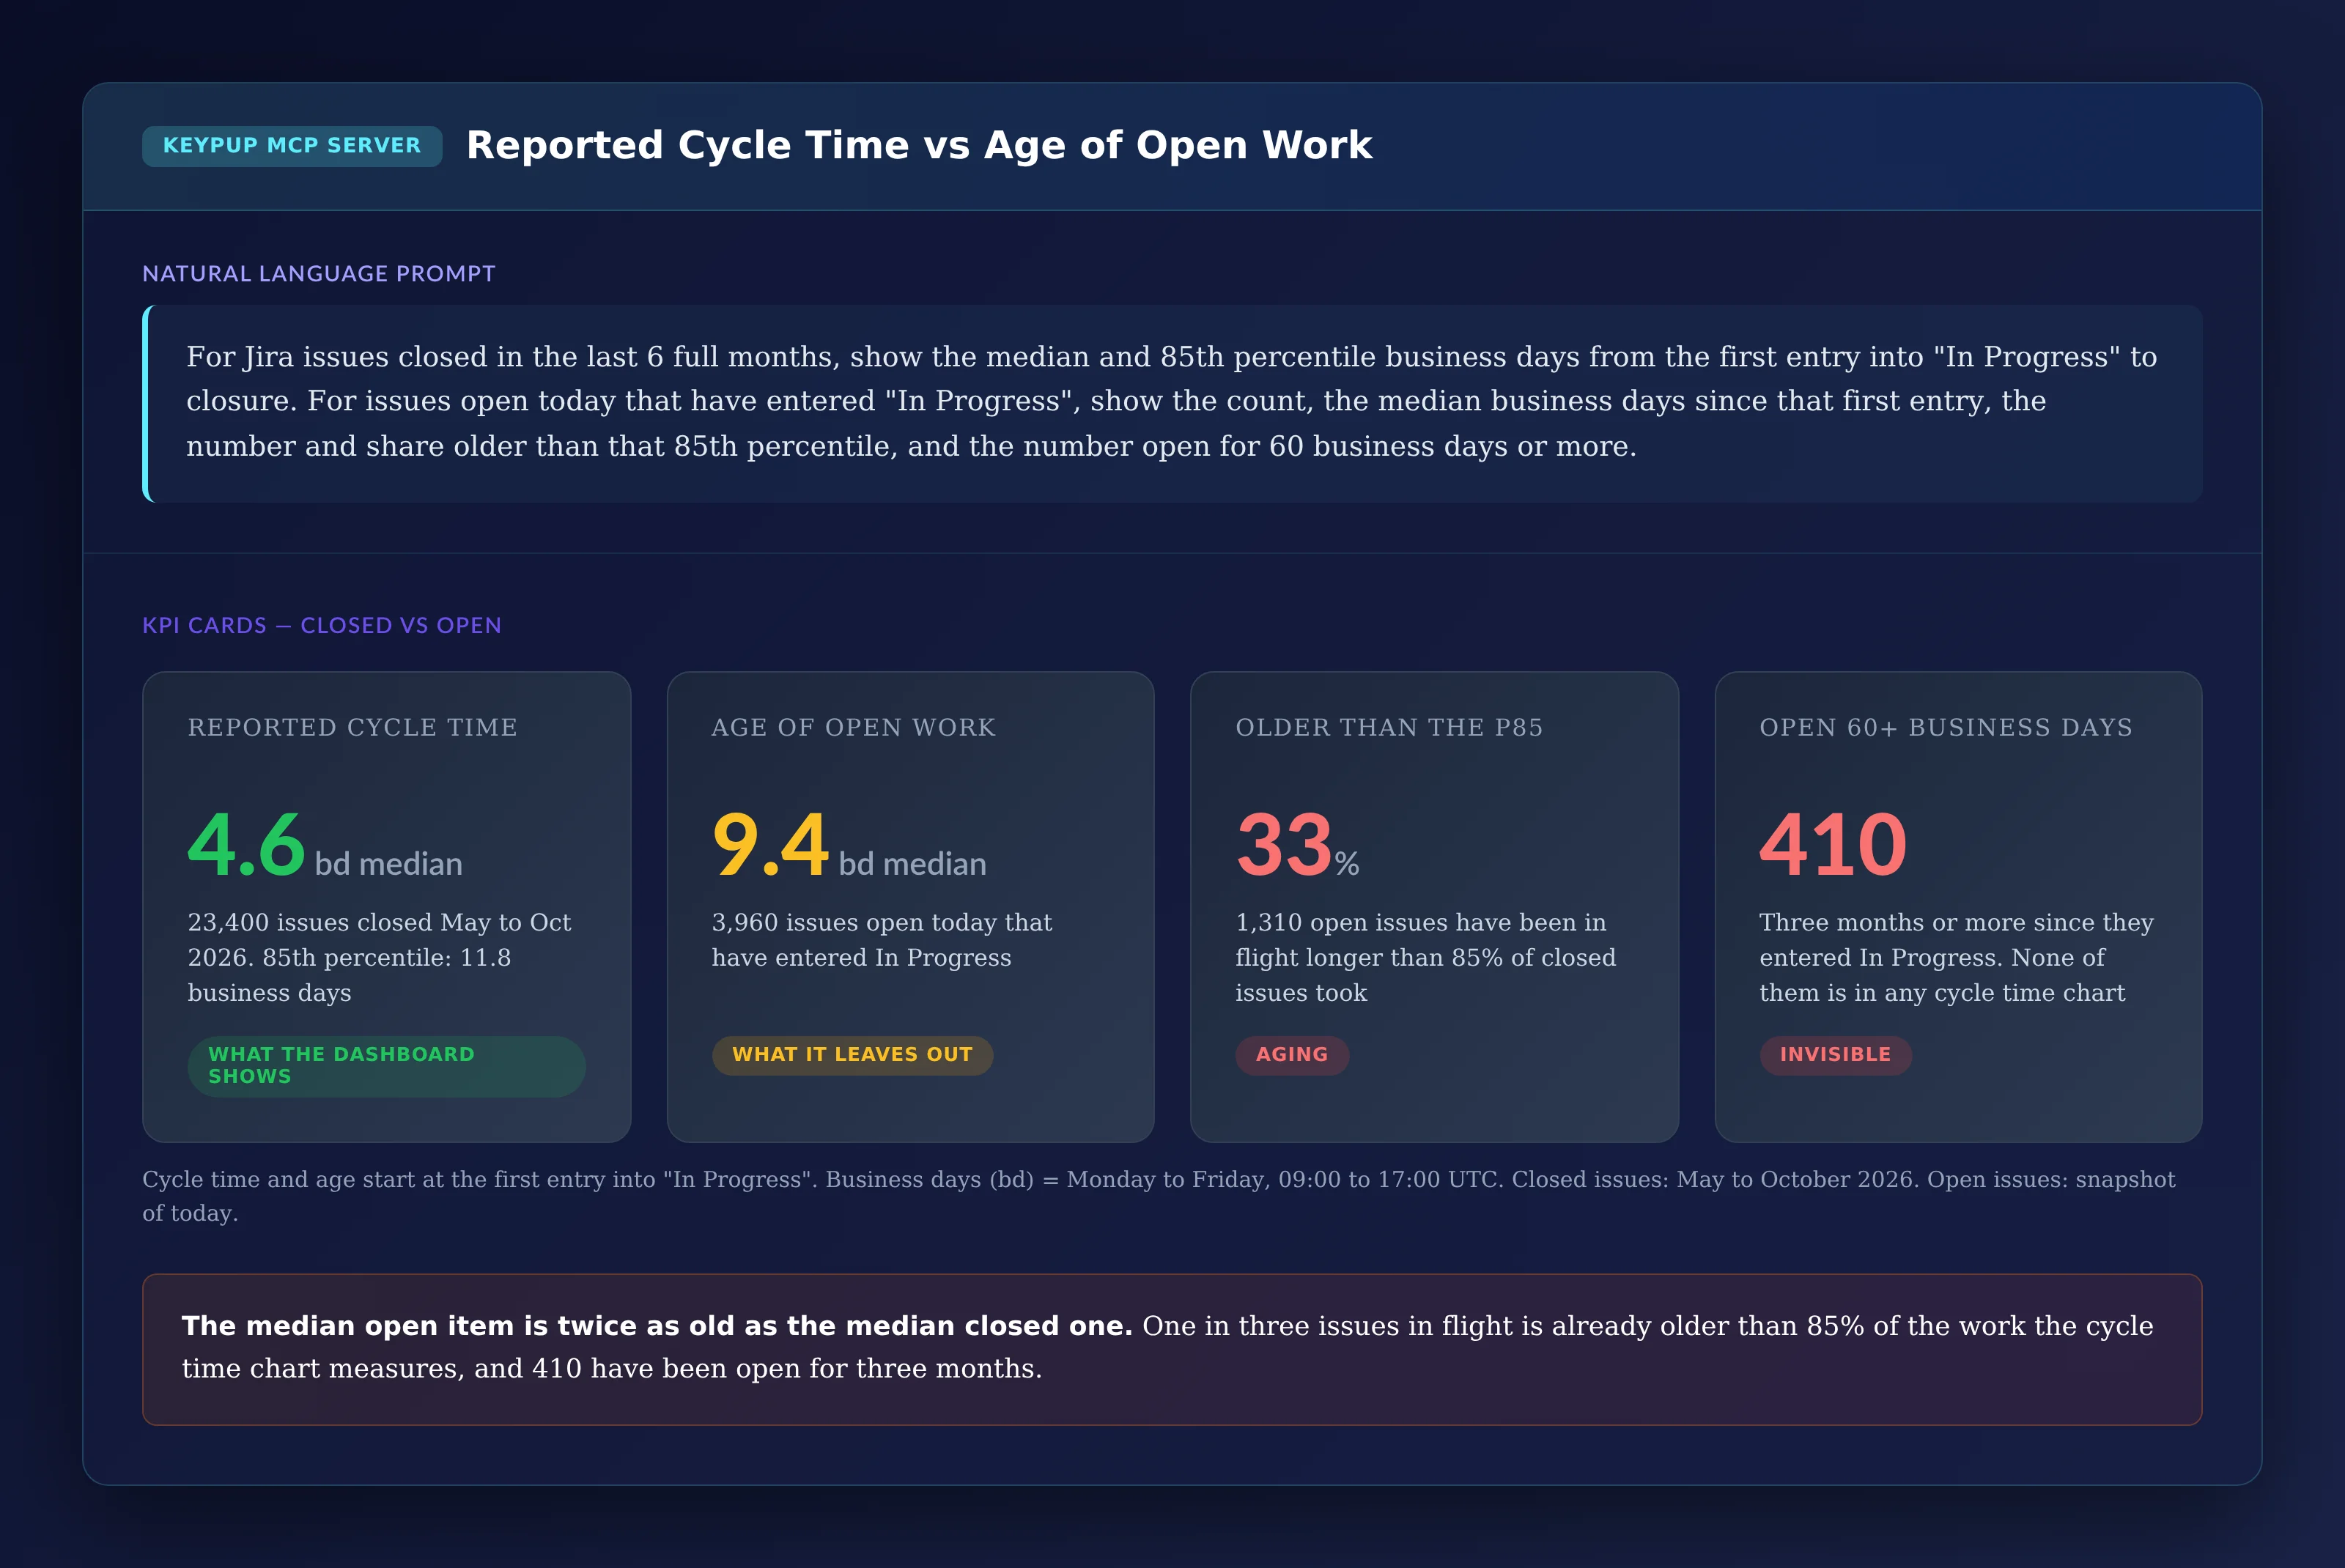
TL;DR: Cycle time is computed on issues that closed. The items that are stuck are, by definition, not in it. In a typical enterprise organization, reported cycle time is a median of 4.6 business days, while the median age of open work is 9.4 business days. 33% of open issues are already older than the 85th percentile of closed cycle time, and 410 have been in flight for more than 60 business days. Over six months, reported cycle time improved by half a day while the median age of open work grew by two and a half. The Keypup MCP Server reads each Jira issue's workflow timeline, current status, assignees, past sprints and story points, and, for the pull requests linked to it through its issue key, the resolution state and the last commit. Your AI assistant can then measure the age of open work against closed cycle time, follow it month by month, find the statuses where work sits still, tell blocked work from unreviewed or unclosed work, and list the oldest items to decide on.
The quarterly delivery review opens on a good slide: cycle time is down for the third quarter running. Ten minutes later, the head of Payments mentions, in passing, the reconciliation story that has been "almost done" since the summer. Then Mobile has one. Then Platform Infra has four. None of them is on the slide, because none of them has closed. The chart is right about everything it measures. It just doesn't measure the work that's in trouble.
The Friction: A Metric That Can Only See Survivors
Cycle time is a property of finished work: start date, end date, difference. That makes it easy to compute and impossible to fool in one direction, and blind in the other:
Stuck work doesn't count until it closes. An item blocked for eight weeks contributes nothing to the chart for eight weeks, then spikes it once, long after anyone could act.
Finishing easy work improves the number. When a team closes small, quick items while the hard ones wait, its median cycle time falls. Nothing went faster.
Abandoned work never counts at all. Items that are quietly parked, or eventually closed as "Won't Do", are never measured as the delay they were.
Percentiles hide the open tail. "85% of our issues close within 12 business days" says nothing about the items that have already been open for 30.
The result: the delivery metric leadership trusts most is structurally optimistic about the exact work leadership most needs to hear about.
Why This Matters: The Real Cost of Measuring Only Survivors
The Forecasting Problem
Forecasts built on closed cycle time assume today's work in progress will behave like yesterday's finished work. When a third of the open items are already older than the 85th percentile, that assumption is wrong for a third of the roadmap, and nobody finds out until the dates slip.
The Escalation Problem
Old work is usually waiting on a decision: a dependency, an architecture call, a product trade-off, a reviewer from another team. A metric that only sees closures surfaces those decisions after the fact, in a retrospective, instead of while someone can still make them.
The Incentive Problem
When teams are measured on cycle time, the rational move is to finish what's easy and leave what's hard. Nobody does it on purpose. The chart rewards it anyway, and the old items keep getting older.
The Enterprise Discussion: What Engineering Leaders Are Actually Saying
"Our cycle time is great, except for the stuff that never finishes", "the dashboard says green, the roadmap says red" and "we only find out about stuck tickets at the retro" come up wherever engineering managers, delivery leads and platform engineers compare notes on flow metrics. The quotes below are representative of recurring threads on r/EngineeringManagers, r/ExperiencedDevs, r/agile and r/projectmanagement.
Director of Engineering, Fintech (r/EngineeringManagers)
"Our cycle time went down three quarters in a row and I got congratulated for it. Meanwhile the two features the CEO actually cared about had been 'in progress' since March. Neither of them was in the number, because neither of them had finished."
Delivery Lead, Telecom (r/agile)
"Every flow dashboard I've seen only looks backwards. I don't need to know how long the done stuff took. I need to know which of the things on the board right now are already in trouble."
"We had a ticket blocked on another team for seven weeks. It didn't show up anywhere until it finally closed and blew up the cycle time for the month. Then everyone asked what happened in that month."
The pattern holds: organizations measure delivery on the work that finished, while the risk sits in the work that hasn't, and nobody looks at how old it is.
How Keypup MCP Measures the Age of Open Work
The Keypup Model Context Protocol (MCP) Server gives your AI assistant structured access to the data Keypup imports from Jira and from GitHub, GitLab, Bitbucket and Azure DevOps. For this analysis, what matters is each Jira issue: its workflow timeline, with when it entered and left each status, its current status, its closure date, its assignees, its past sprints and its story points; and, for the pull requests linked to it, the issue's resolution state, which says whether a linked pull request is still open or all of them are merged, and the date of the last commit.
Cycle time runs from an issue's first entry into "In Progress" to its closure. Age runs from the same first entry to today, for issues still open. Both are counted in business days, 09:00 to 17:00 UTC, Monday to Friday. Closed figures cover issues closed in the last six full months, May to October 2026; open figures are a snapshot of today, for an organization of around 1,100 engineers in eight Jira projects.
1. Comparing Reported Cycle Time With the Age of Open Work
The first question: how different is the work in flight from the work the chart measures?
MCP Prompt:
For Jira issues closed in the last 6 full months, show the median and
85th percentile business days from the first entry into "In Progress"
to closure. For issues open today that have entered "In Progress",
show the count, the median business days since that first entry, the
number and share older than that 85th percentile, and the number open
for 60 business days or more.
Output: Reported Cycle Time vs Age of Open Work
Key Insight: The median open item is twice as old as the median closed one. 1,310 of the 3,960 issues in flight, one in three, are already older than 85% of the work the cycle time chart measures. 410 have been open for three months or more.
2. Seeing How Old the Work in Flight Really Is
A median hides the tail. Putting the age of open work next to the cycle time of closed work shows where the two distributions part.
MCP Prompt:
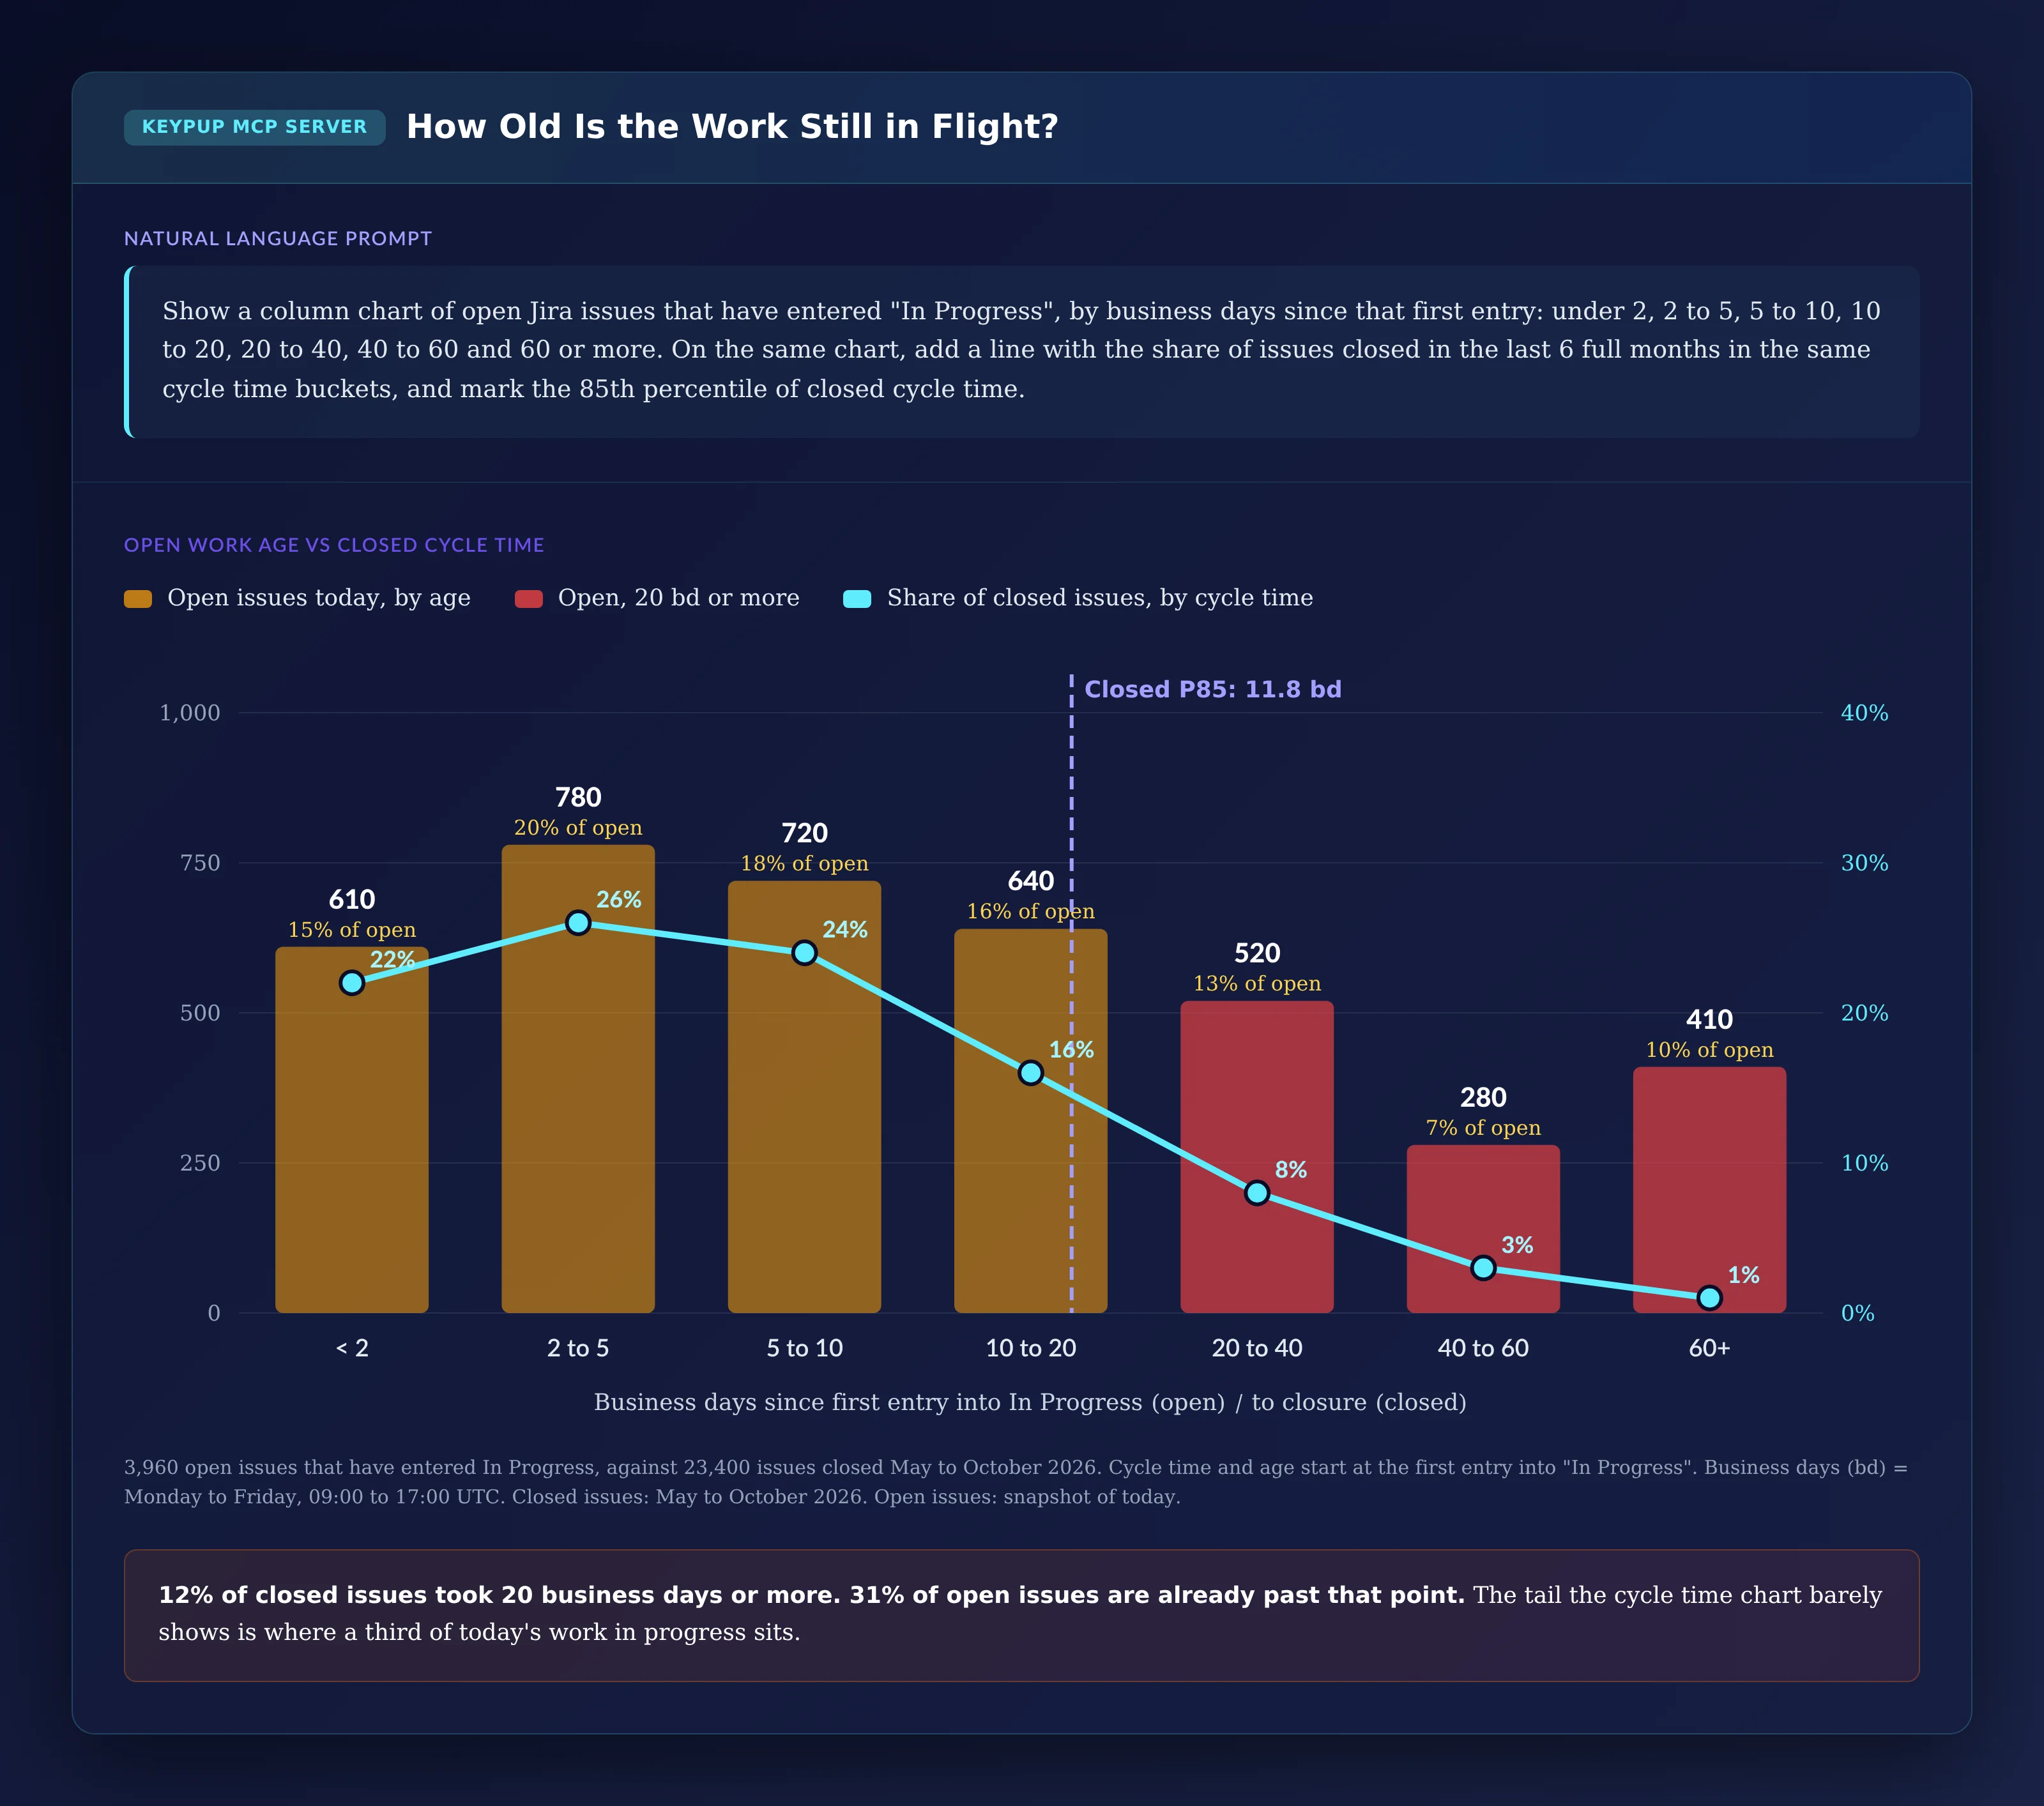
Show a column chart of open Jira issues that have entered "In Progress",
by business days since that first entry: under 2, 2 to 5, 5 to 10,
10 to 20, 20 to 40, 40 to 60 and 60 or more. On the same chart, add a
line with the share of issues closed in the last 6 full months in the
same cycle time buckets, and mark the 85th percentile of closed cycle
time.
Output: Open Work Age vs Closed Cycle Time
Key Insight: 12% of closed issues took 20 business days or more. 31% of open issues, 1,210 items, are already past that point. The tail that the cycle time chart barely shows is where almost a third of today's work in progress sits.
3. Checking Whether the Process Is Faster or Just Finishing the Easy Work
If old work piles up while closed work speeds up, the trend tells the opposite story to the chart.
MCP Prompt:
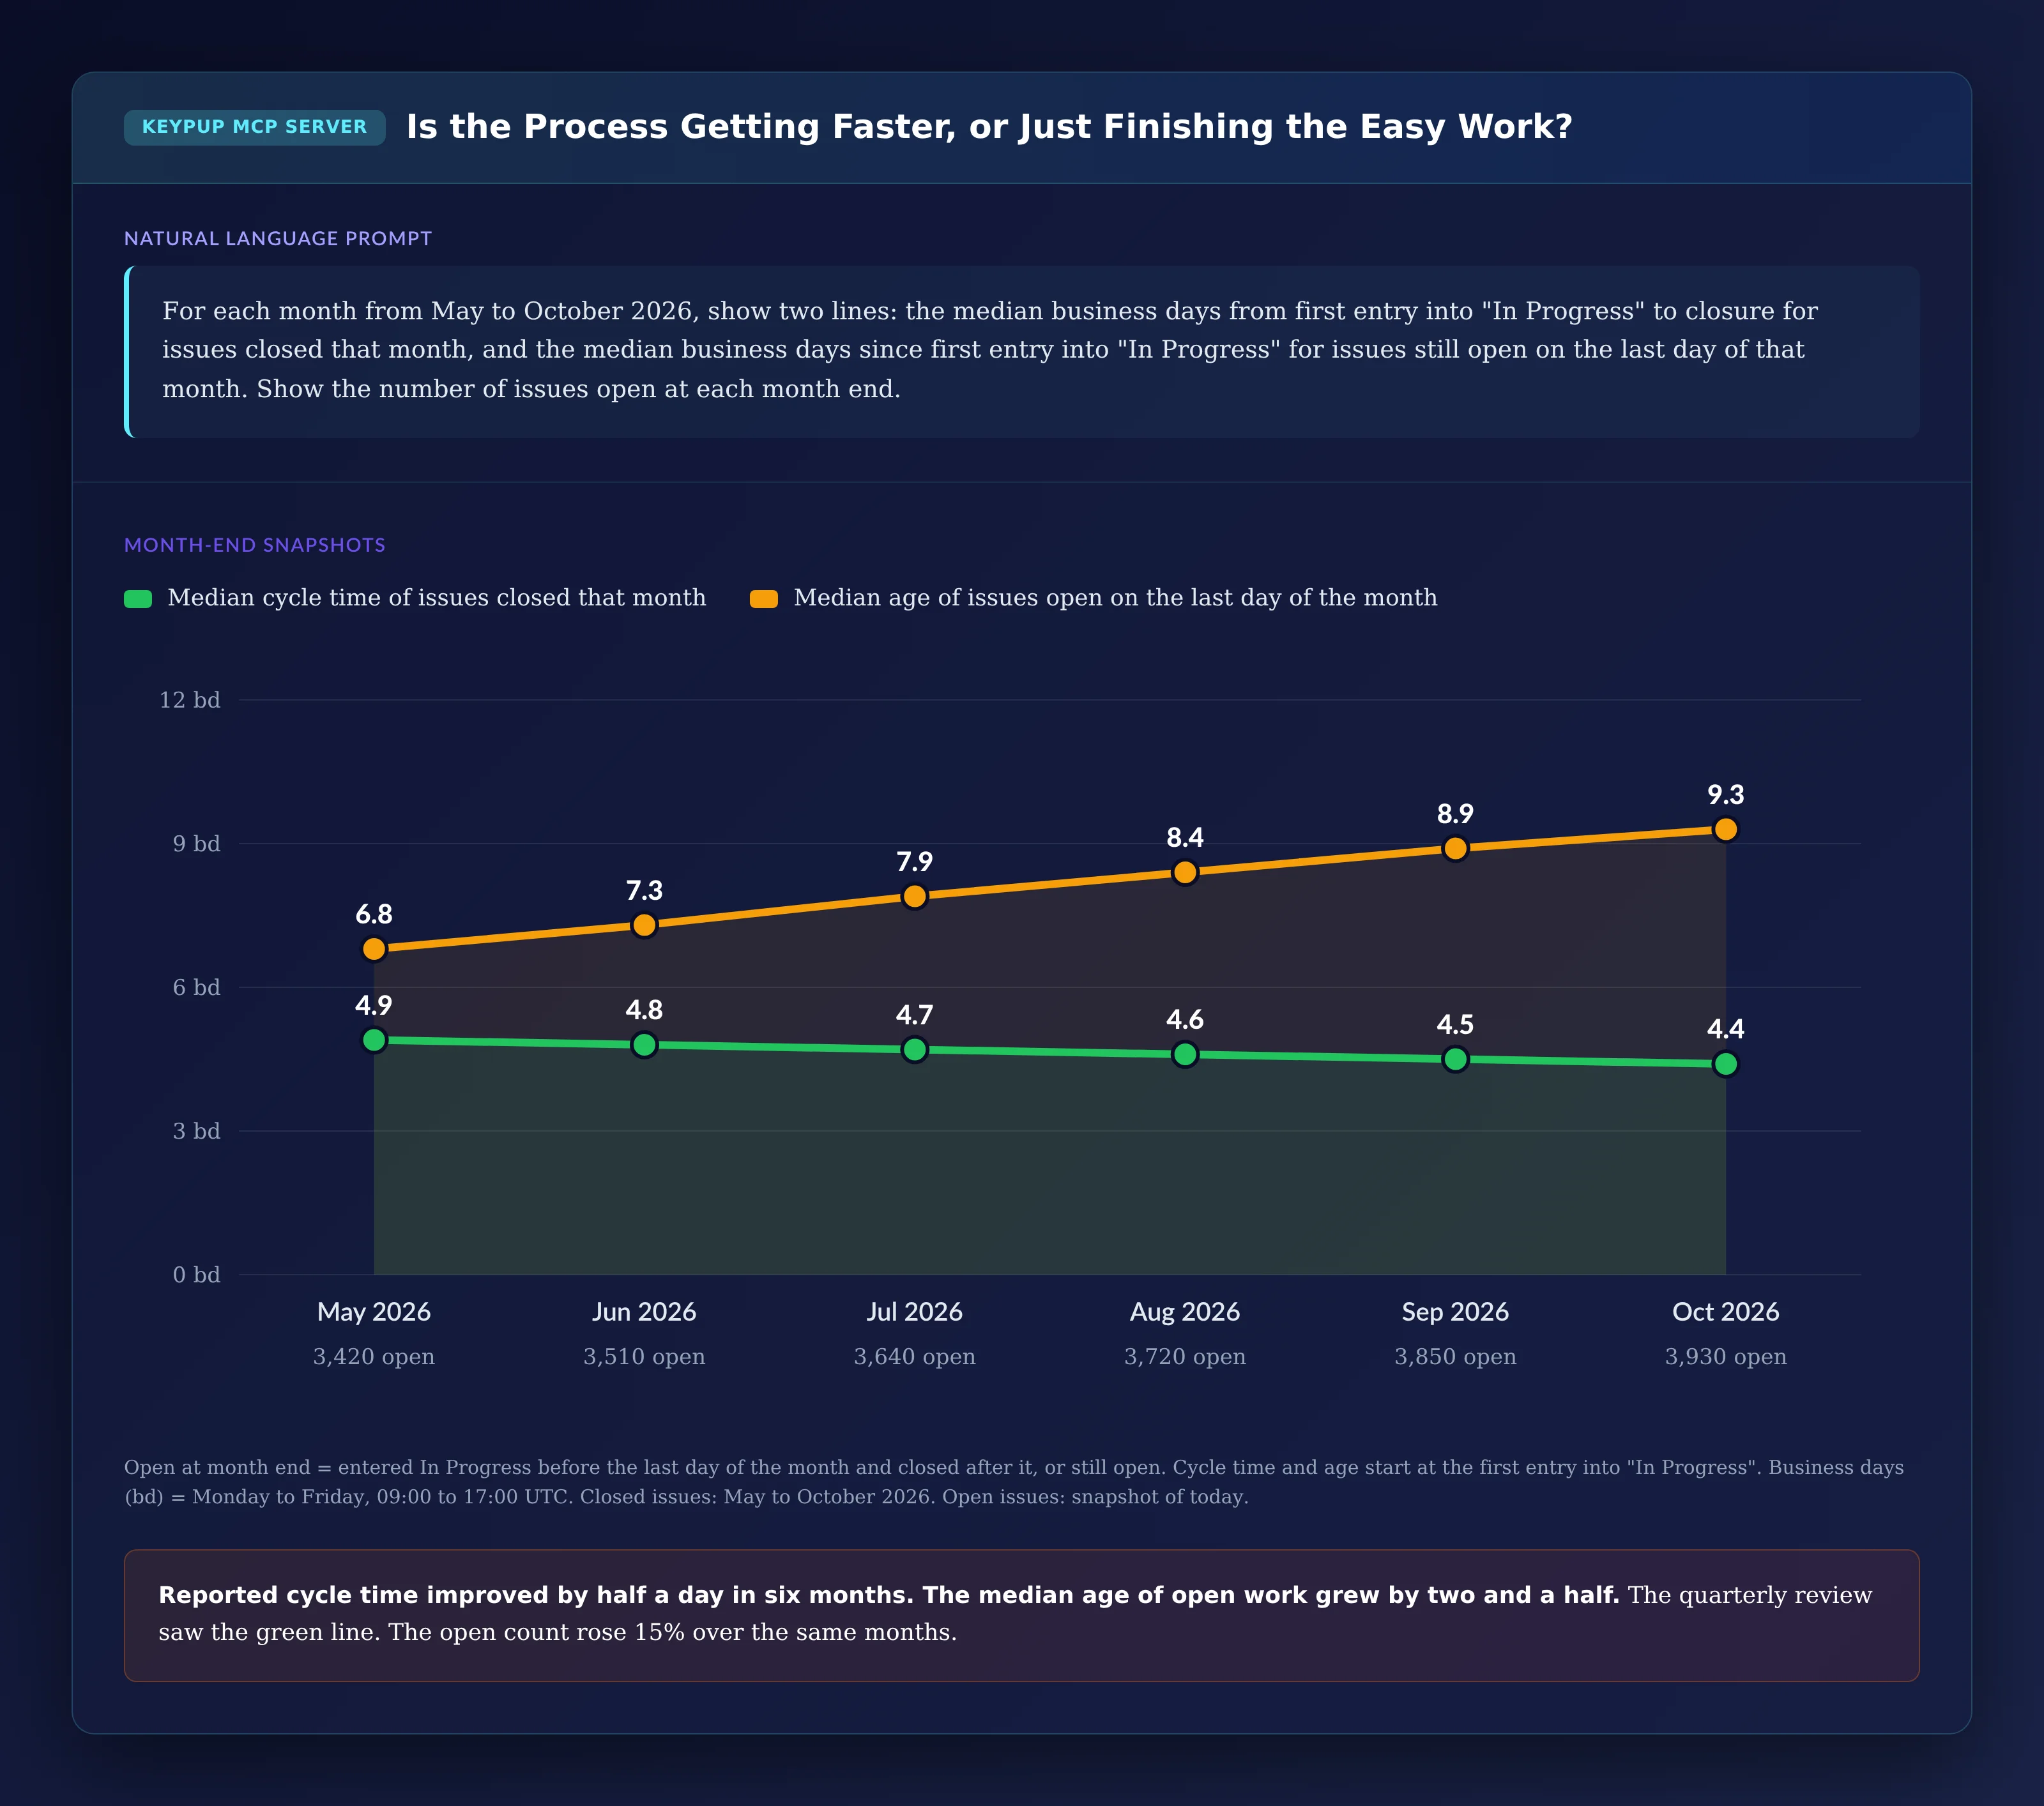
For each month from May to October 2026, show two lines: the median
business days from first entry into "In Progress" to closure for issues
closed that month, and the median business days since first entry into
"In Progress" for issues still open on the last day of that month.
Show the number of issues open at each month end.
Output: Month-End Snapshots
Key Insight: Reported cycle time improved by half a business day in six months. Over the same months, the median age of open work grew by two and a half, and the number of open items rose 15%. The quarterly review saw the green line. The orange one is where the delivery risk was building.
4. Finding Where Open Work Sits Still
An issue can be old because it's large, or because it stopped moving. The time spent in its current status tells the two apart.
MCP Prompt:
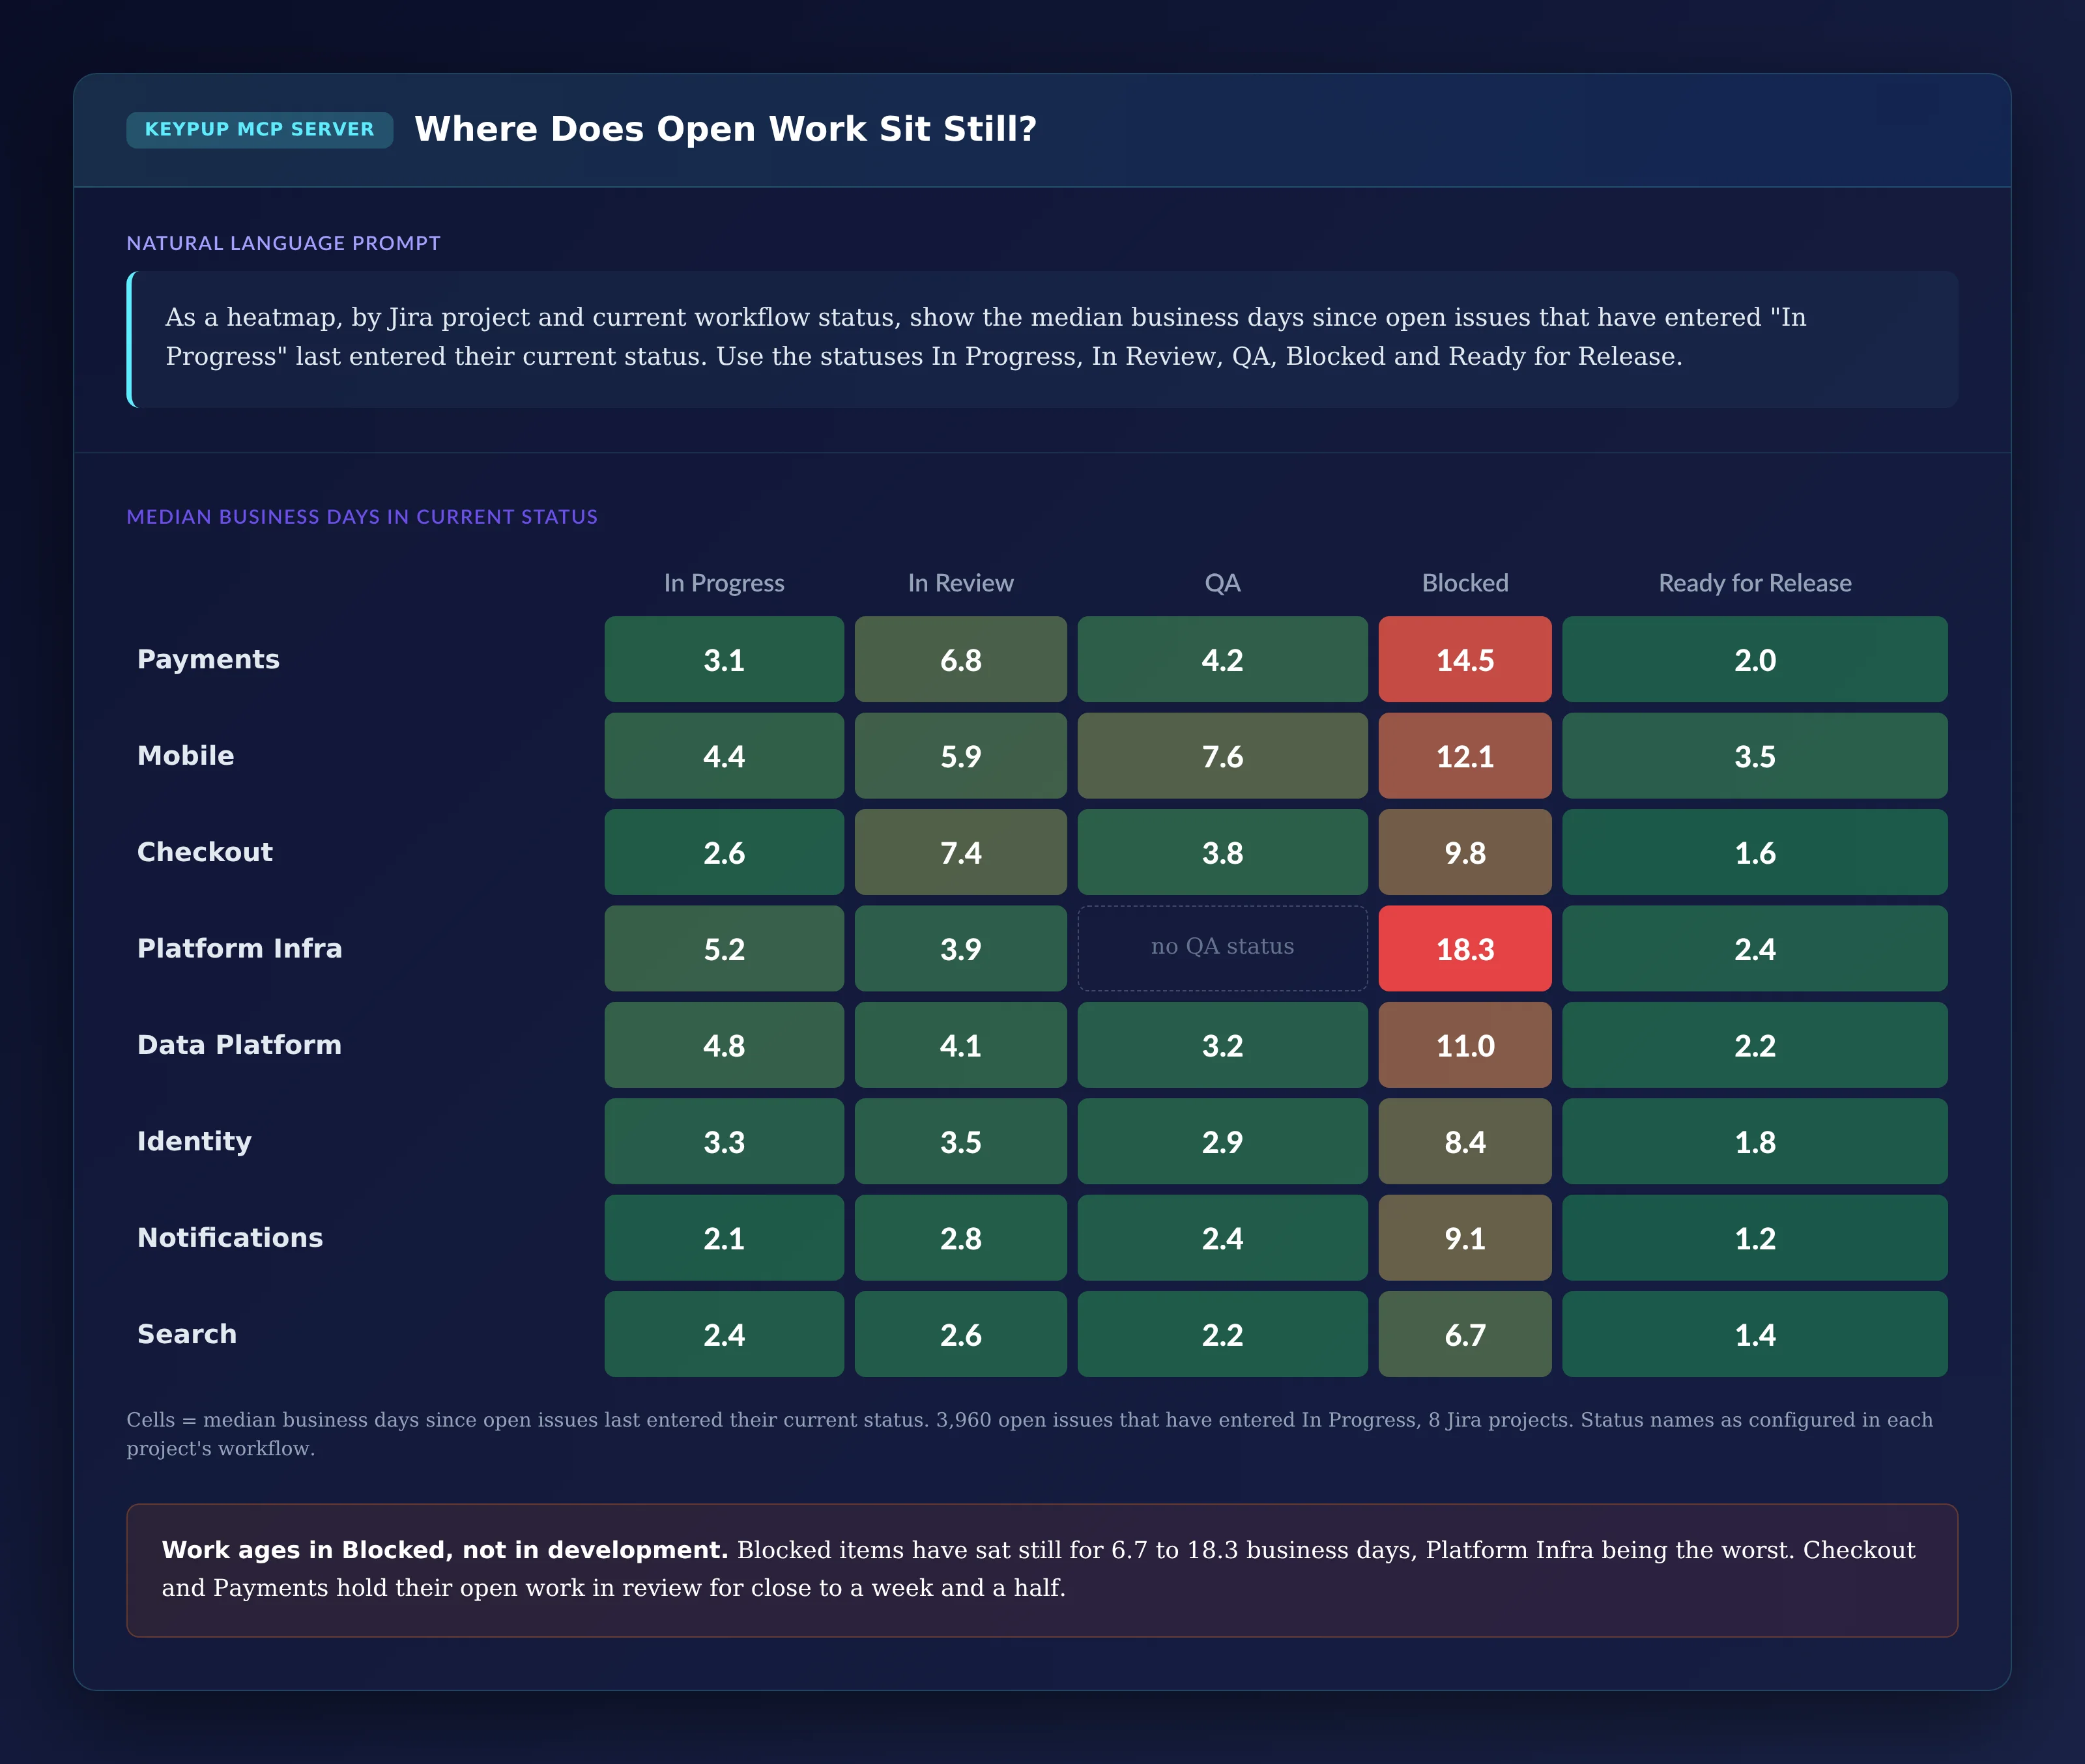
As a heatmap, by Jira project and current workflow status, show the
median business days since open issues that have entered "In Progress"
last entered their current status. Use the statuses In Progress,
In Review, QA, Blocked and Ready for Release.
Output: Median Business Days in Current Status
Key Insight: Work ages in Blocked, not in development. Blocked items have sat still for a median of 6.7 to 18.3 business days, with Platform Infra the worst. Checkout and Payments hold open work in review for about a week and a half, and Mobile's QA queue holds it for a week and a half too. Each cell is a different conversation with a different owner.
5. Telling Blocked Work From Unreviewed or Unclosed Work
The same age can mean three different things, depending on what code is behind the issue.
MCP Prompt:
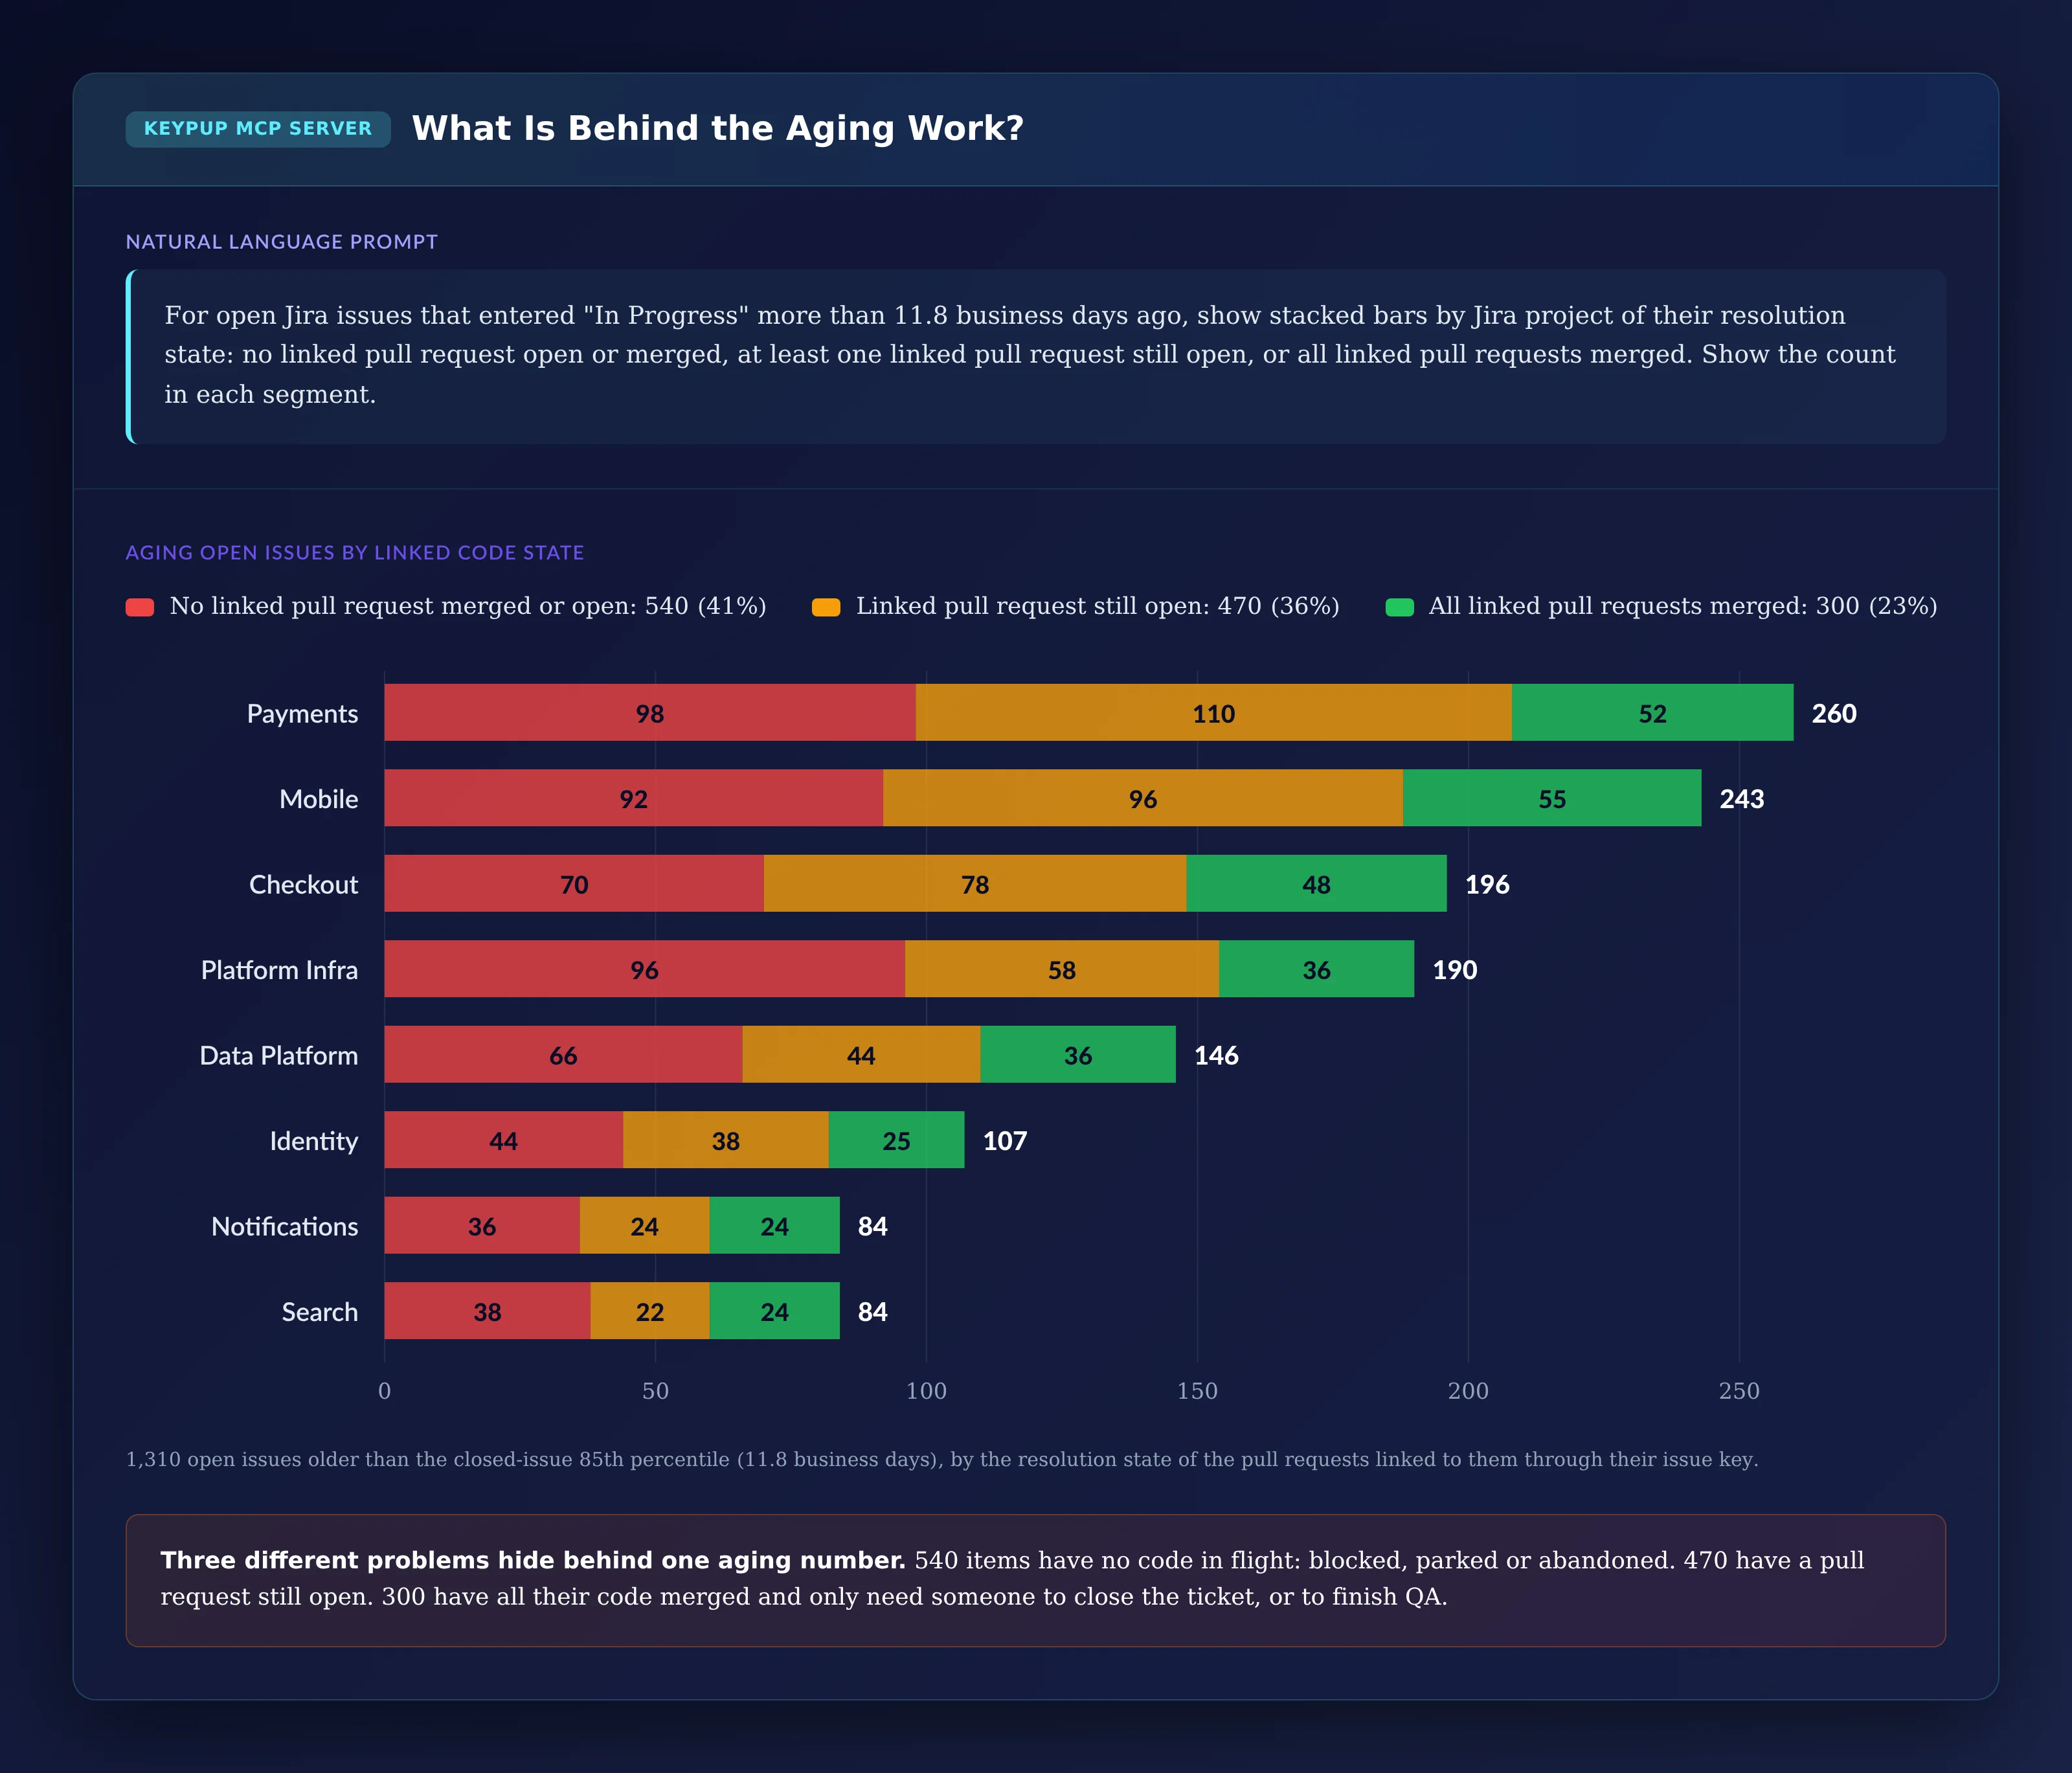
For open Jira issues that entered "In Progress" more than 11.8 business
days ago, show stacked bars by Jira project of their resolution state:
no linked pull request open or merged, at least one linked pull request
still open, or all linked pull requests merged. Show the count in each
segment.
Output: Aging Open Issues by Linked Code State
Key Insight: Three different problems hide behind one aging number. 540 items have no code in flight: blocked, parked, waiting on a decision, or with pull requests that don't reference the issue key. 470 have a pull request still open. 300 have all their code merged and only need someone to finish QA or close the ticket. Half of Platform Infra's aging work has no code in flight; the largest share of Payments' is waiting on open pull requests.
6. Finding Teams That Look Fast but Hold Old Work
Comparing teams on cycle time alone rewards the ones that finish the easy work first.
MCP Prompt:
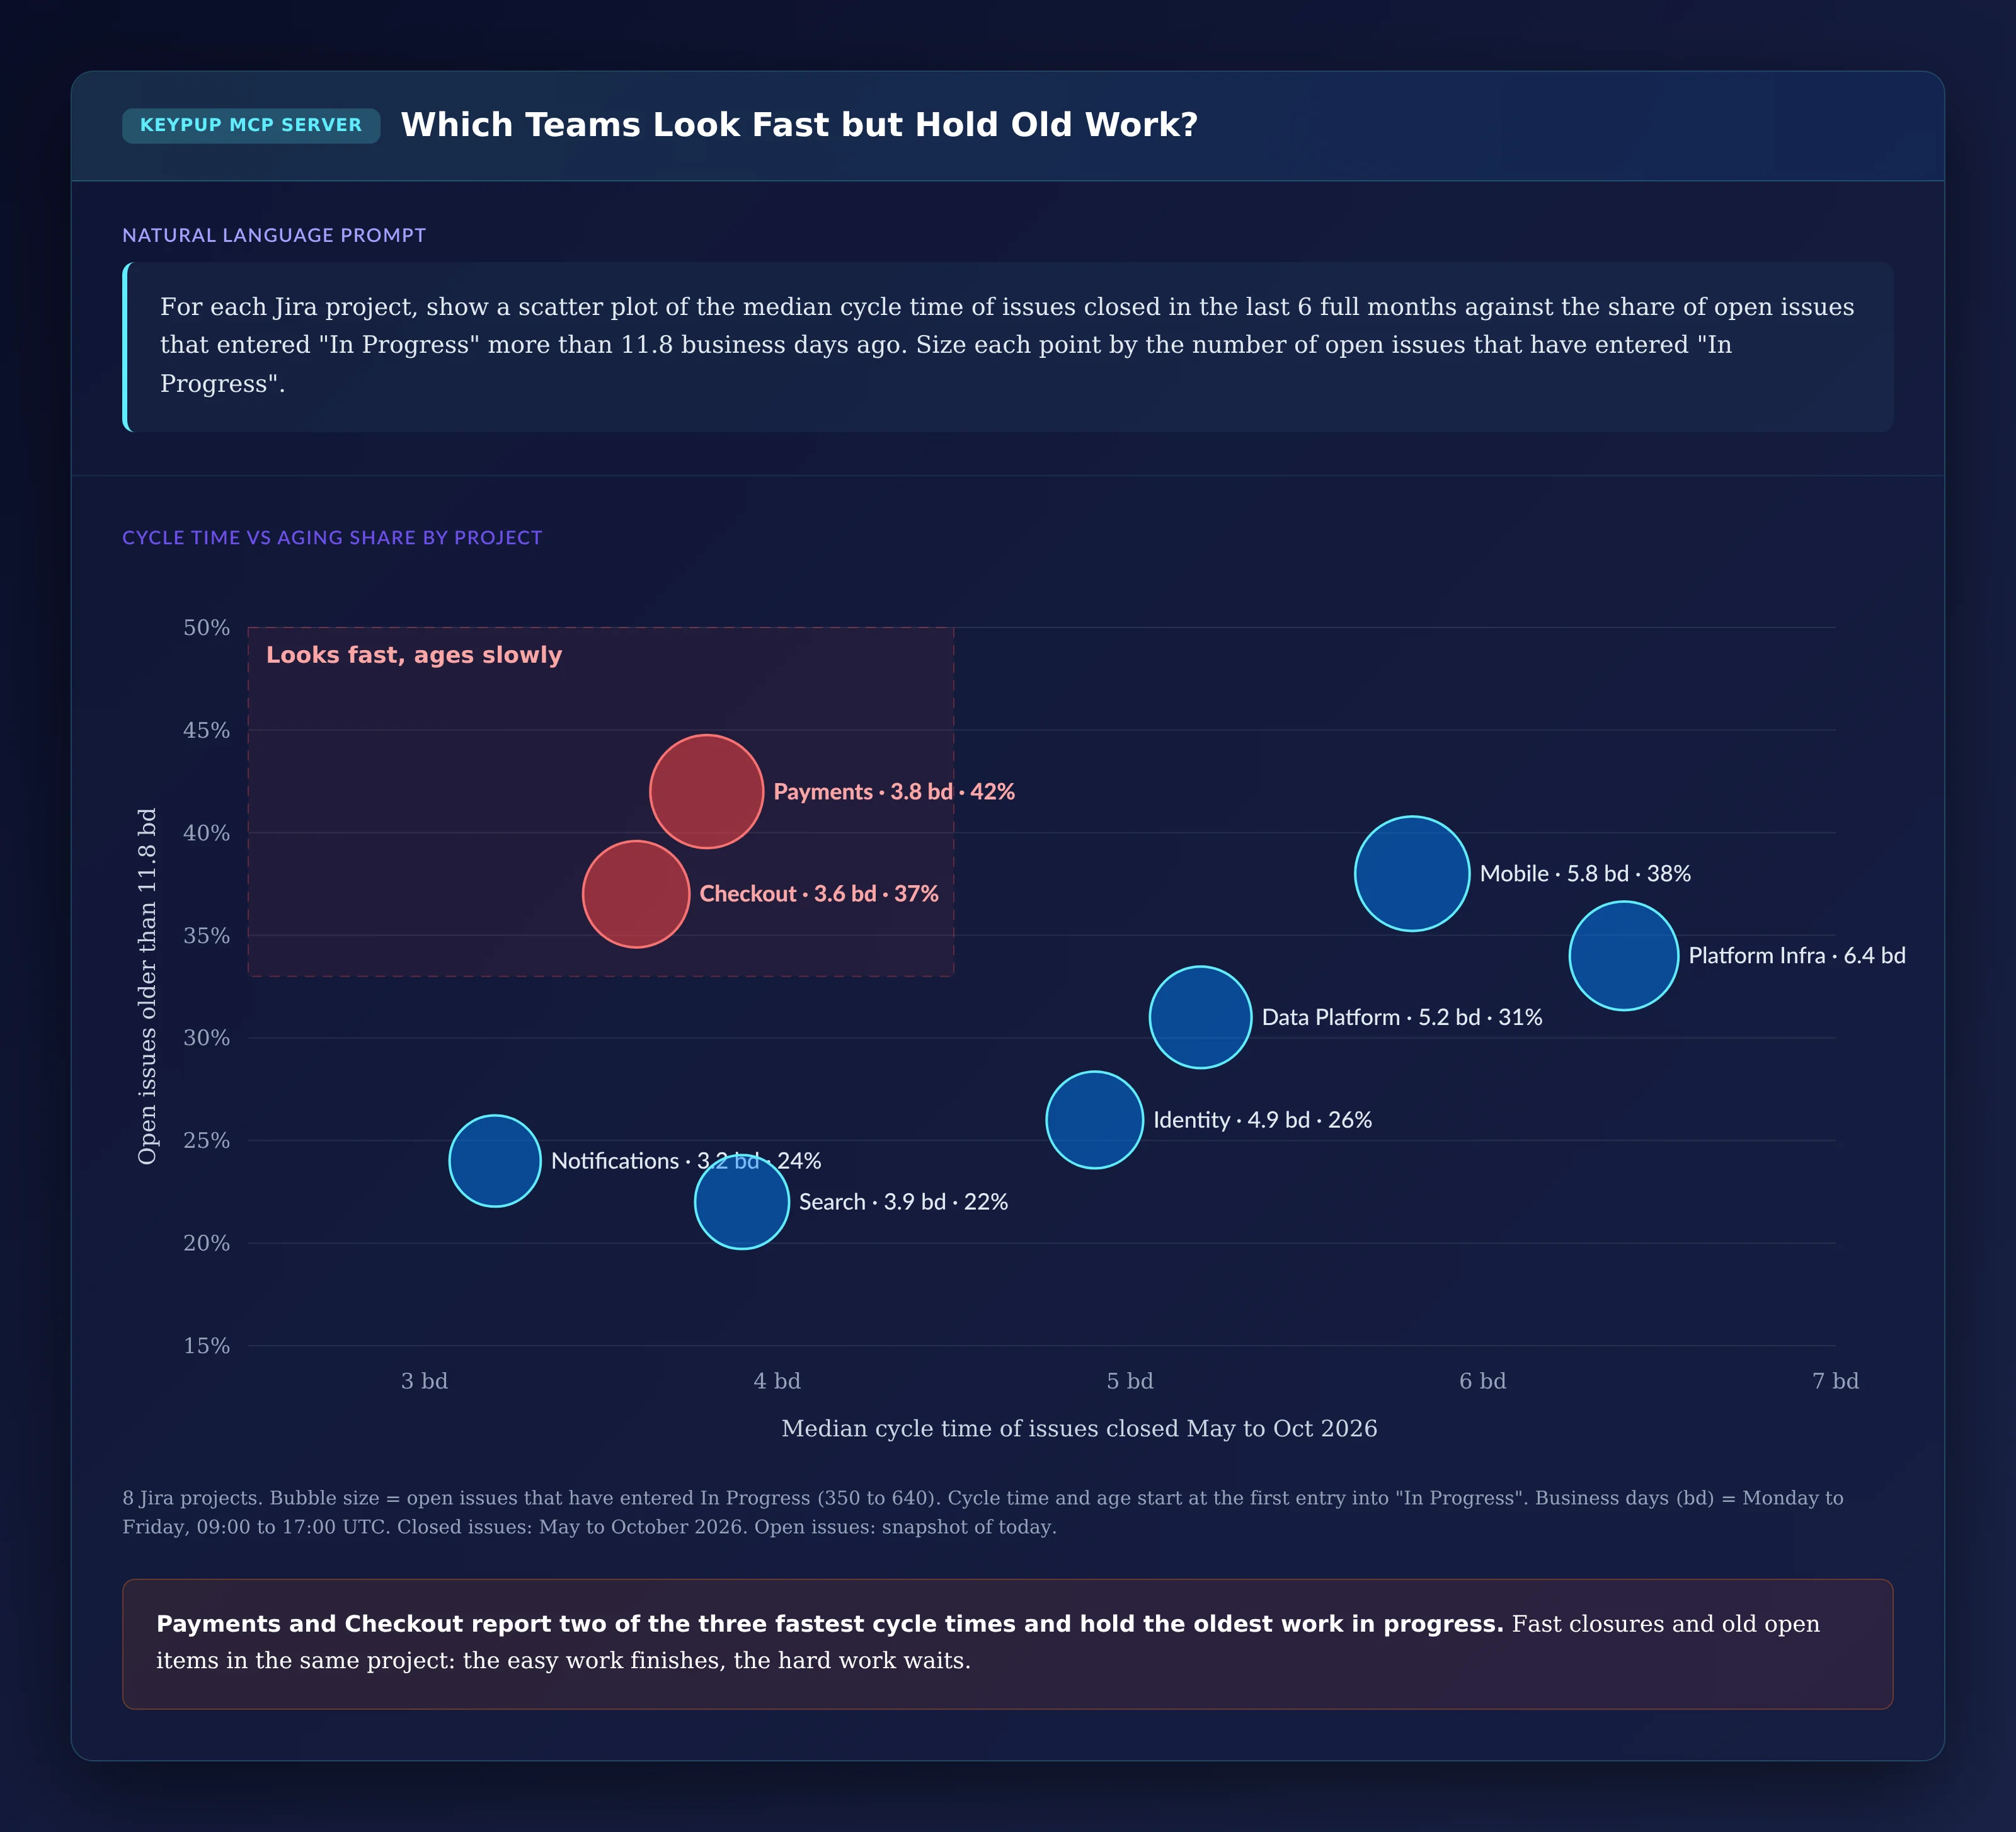
For each Jira project, show a scatter plot of the median cycle time of
issues closed in the last 6 full months against the share of open
issues that entered "In Progress" more than 11.8 business days ago.
Size each point by the number of open issues that have entered
"In Progress".
Output: Cycle Time vs Aging Share by Project
Key Insight: Payments and Checkout report two of the three fastest cycle times, and hold the highest share of aging work. On a cycle time leaderboard, they're at the top. On the board, 42% and 37% of their open items are older than the 85th percentile. Notifications shows that fast closures don't have to come with old open work.
7. Listing the Oldest Work to Decide On
Measurement is only useful if it ends with a list someone can act on this week.
MCP Prompt:
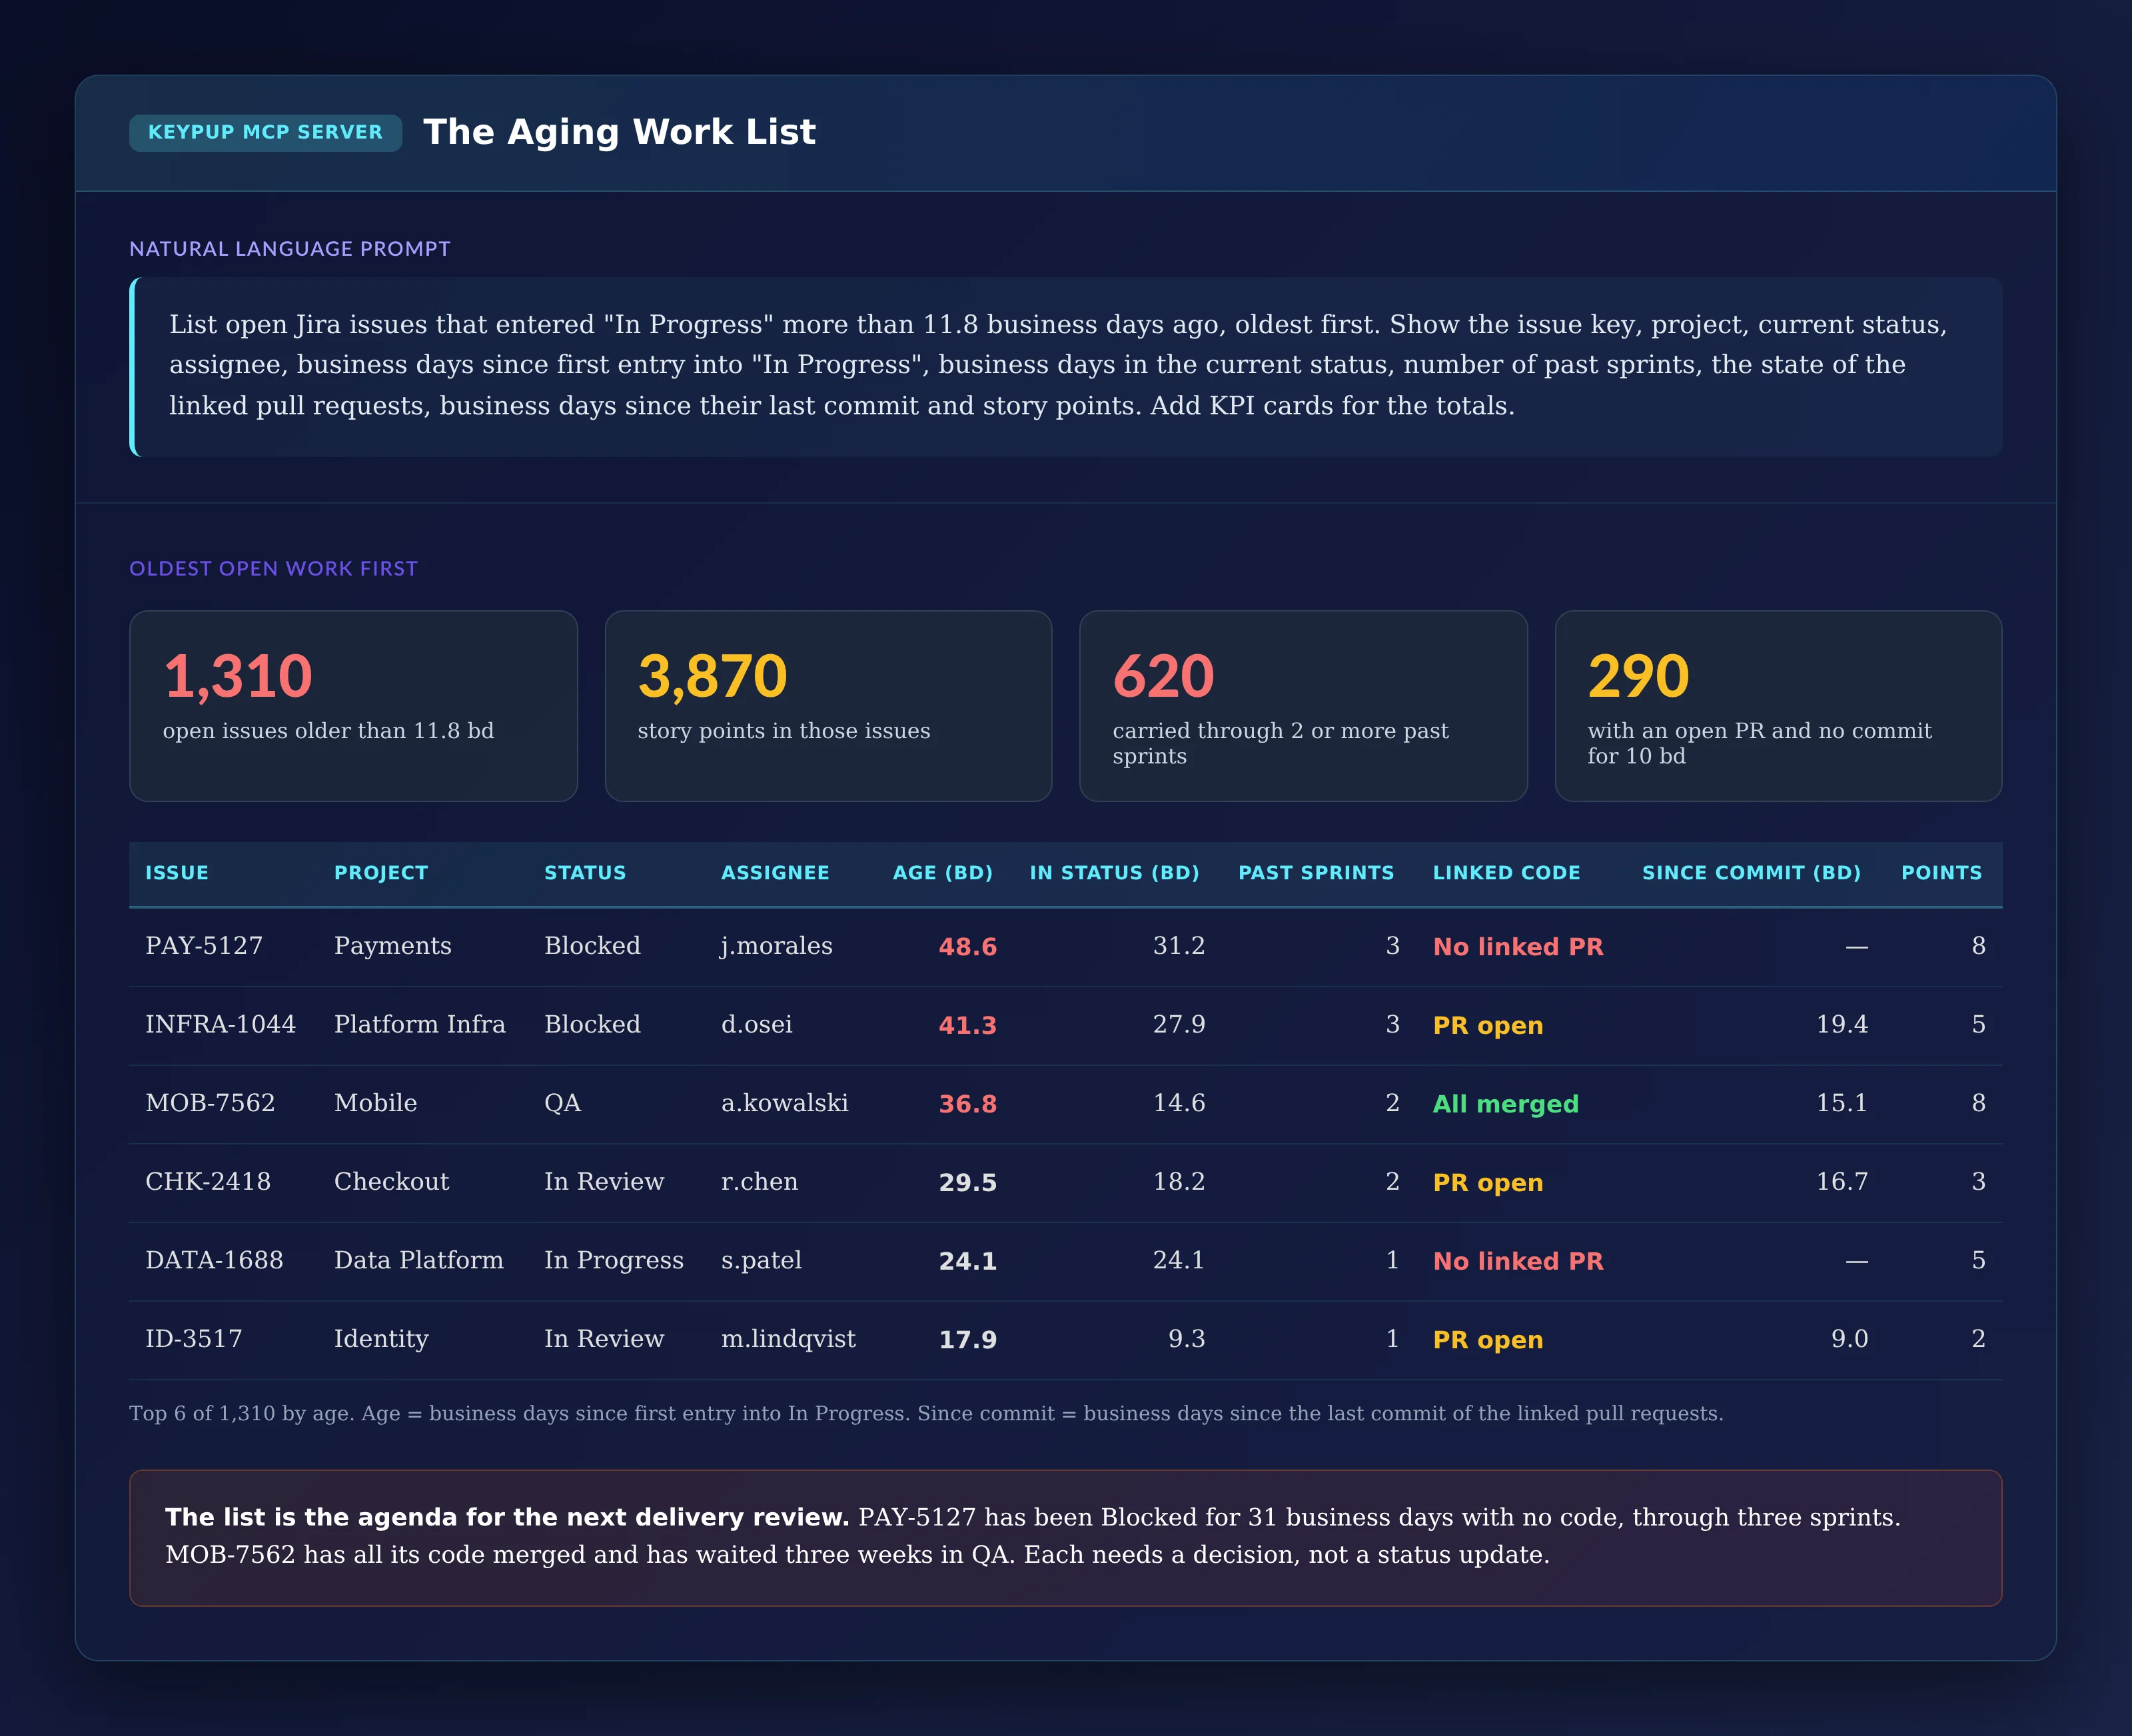
List open Jira issues that entered "In Progress" more than 11.8 business
days ago, oldest first. Show the issue key, project, current status,
assignee, business days since first entry into "In Progress", business
days in the current status, number of past sprints, the state of the
linked pull requests, business days since their last commit and story
points. Add KPI cards for the totals.
Output: The Aging Work List
Issue
Project
Status
Assignee
Age (bd)
In status (bd)
Past sprints
Linked code
Since commit (bd)
Points
PAY-5127
Payments
Blocked
j.morales
48.6
31.2
3
No linked PR
—
8
INFRA-1044
Platform Infra
Blocked
d.osei
41.3
27.9
3
PR open
19.4
5
MOB-7562
Mobile
QA
a.kowalski
36.8
14.6
2
All merged
15.1
8
CHK-2418
Checkout
In Review
r.chen
29.5
18.2
2
PR open
16.7
3
DATA-1688
Data Platform
In Progress
s.patel
24.1
24.1
1
No linked PR
—
5
ID-3517
Identity
In Review
m.lindqvist
17.9
9.3
1
PR open
9.0
2
Key Insight: The list is the agenda for the next delivery review. PAY-5127 has been Blocked for 31 business days with no code, through three sprints. MOB-7562 has all its code merged and has waited three weeks in QA. DATA-1688 has been "In Progress" for almost five weeks without a linked pull request. Each needs a decision, not a status update.
The Technical Implementation: What Keypup MCP Actually Reads
Every number above comes from fields Keypup already imports from Jira and your Git platforms. It helps to be precise about what each one depends on.
Age Comes From the Workflow Timeline
Keypup imports each issue's workflow timeline: every status it went through, with when it entered and left it. TIMELINE_FIRST_START_AT returns when an issue first entered a status, which is where both cycle time and age start; TIMELINE_LAST_START_AT returns when it last entered its current status, which is how time in status is measured. Status names are whatever your Jira workflows use: a project with "In Development" instead of "In Progress", or no "QA" status, needs its own names in the prompt.
Percentiles and Business Days Come From Formulas, Not a Calendar
MEDIAN and PERCENTILE compute the cycle time thresholds; BUSINESS_DAYS counts working time between two dates, Monday to Friday, 09:00 to 17:00 UTC by default, and accepts another time zone, working hours and working days. It doesn't know about public holidays or vacations: Keypup doesn't import calendars. The 11.8-day threshold in the prompts is the result of the first query; use your own.
Month-End Snapshots Are Reconstructed From Dates
The work open at the end of a past month is every issue that had entered "In Progress" before that day and was closed after it, or is still open. Keypup rebuilds it from the workflow timeline and the closure date, so no snapshot needs to have been taken at the time.
Code State Comes From Issue Keys
Keypup links a pull request to a Jira issue when the pull request references the issue key: in its title, or in its body or a commit message after a closing keyword such as "fixes", "closes" or "resolves". Each issue then carries a resolution state: in progress when at least one linked pull request is open, implemented when all of them are merged, none when there are none or they were all closed without merging; and the date of the last commit among them. An issue whose pull requests don't reference its key shows as having no code, so check the share of merged pull requests with a linked issue before reading the "no linked pull request" segment.
Sprints, Points and Assignees Come From Jira's Own Fields
Each issue carries its assignees, its story points and the list of past sprints it went through before its current one. Projects that don't run sprints or don't estimate in points won't contribute to those totals: count issues instead.
What Keypup Doesn't See
Keypup doesn't read the reason an item is blocked, the discussion in a standup or a chat thread, or whether an item is deliberately parked: an issue someone has paused on purpose ages like any other until its status says so. It doesn't see work that hasn't reached a pull request yet, so "no linked pull request" can mean no code, or code still on a local branch. And it doesn't know whether merged code has been deployed, only whether it has merged.
Real-World Impact: Enterprise Case Studies
Case Study 1: European Payments Provider
Before Keypup MCP:
800 engineers in 11 Jira projects, cycle time reported to the executive committee every quarter
Three consecutive quarters of falling cycle time, and two flagship features more than a quarter late
Stuck work discovered in retrospectives, after it had already moved the release date
After Keypup MCP:
The month-end snapshot went into the executive pack, next to cycle time: two lines instead of one
The aging work list was reviewed every Monday by delivery leads, starting with items older than the 85th percentile
Open items older than 40 business days fell by 58% in two quarters, mostly by unblocking or explicitly cancelling them
"We'd been celebrating a number that couldn't see our two biggest problems. Putting the age of open work on the same slide changed what the committee asked about, and what the teams escalated."
— VP Engineering, European Payments Provider
Case Study 2: North American Insurance Carrier
Before Keypup MCP:
1,300 engineers, team cycle time used as a quarterly objective
Teams with the best cycle time also had the longest-running open epics
No shared definition of "stuck": each manager kept a personal list
After Keypup MCP:
The scatter view showed the pattern: the fastest teams held the largest share of aging work
The objective changed from median cycle time to the share of open work older than the 85th percentile
Blocked time became a standing agenda item for cross-team dependency reviews, driven by the status heatmap
"Our objective was rewarding teams for leaving the hard work alone. Once we measured the age of what was open, the hard work stopped being the work nobody wanted to pick up."
— Head of Delivery, North American Insurance Carrier
Implementation: Getting Started with Keypup MCP
1. Connect Jira and Your Git Platforms
Connect Jira and GitHub, GitLab, Bitbucket or Azure DevOps to Keypup. Issues, workflow timelines, sprints, story points, assignees, pull requests and commits are imported automatically.
2. Map Your Start Status
Write down, for each Jira project, the status that means work has started, and the statuses where open work can wait, such as Blocked, In Review or QA. Use those names in every prompt.
3. Check How Many Pull Requests Reference an Issue Key
The code state view only works on linked issues. Ask your assistant for the share of merged pull requests linked to a Jira issue by project, and agree on a pull request title convention with the issue key where it's low.
4. Connect the MCP Server to Your AI Assistant
Connect the MCP server to your AI assistant using the MCP documentation, compute your own 85th percentile of closed cycle time, and run the age of open work against it to set a baseline.
5. Report Both Lines, Review the List
Put the month-end age of open work next to cycle time in every delivery report, and review the aging work list every week, oldest first, with a decision for each item: unblock, split, reassign or cancel.
Frequently Asked Questions
Why does cycle time miss stuck work?
Because cycle time is computed when an item closes. Work that's stuck hasn't closed, so it isn't in the number until it finishes, often weeks later, when the delay can no longer be acted on. Measuring the age of open work, from its first entry into "In Progress" to today, shows the stuck items while they're still in flight.
What is a good threshold for aging work in progress?
Use your own history. The 85th percentile of closed cycle time over the last few months is a common choice: an open item older than that is already slower than 85% of the work your teams finished. Count how many open items are past it, by team and by status, and follow the share over time.
Can cycle time improve while delivery gets worse?
Yes. When teams finish small, quick items and leave the hard ones open, median cycle time falls while the hard items keep aging. Following the median age of work open at each month end next to cycle time shows whether the process is faster or only finishing the easy work first.
Should we close or cancel very old work in progress?
Often, yes, but as a decision rather than a cleanup. An item that has been blocked for months is either waiting on something someone can unblock, or no longer worth doing. Reviewing the oldest items each week, with their status, assignee, past sprints and linked code, makes that decision explicit instead of leaving the item to age.
The Bottom Line
Cycle time tells you how long the work that finished took. It can't tell you about the work that hasn't, and in many enterprise organizations, that's a third of what's in flight. Keypup MCP measures the work the chart leaves out:
✅ Comparing reported cycle time with the age of open work, on the same threshold ✅ Seeing how old the work in flight really is, including the long tail ✅ Checking whether the process is faster or only finishing the easy work first ✅ Finding where open work sits still, by team and by status ✅ Telling blocked work from unreviewed or unclosed work, through the linked pull requests ✅ Finding teams that look fast but hold old work, before setting objectives ✅ Listing the oldest work to decide on, with who owns each item
Ready to Transform Your Analytics?
Join teams already using AI to make data-driven decisions faster than
ever.
In a typical enterprise, the Jira board trails Git by almost two business days per issue: code is written before tickets reach "In Progress", and tickets stay open days after their pull requests merge. Learn what engineering leaders on Reddit say about stale boards, status-chasing standups and sprint carryover that exists only on paper, and how Keypup MCP compares each issue's workflow timeline with the commits and merges of its linked pull requests to measure the lag and list the tickets to close.
In a typical distributed enterprise, a pull request reviewed from another hub waits 4.1 times longer for a first review, and each round of requested changes costs a day instead of a few hours. Learn what engineering leaders on Reddit say about code review across time zones, and how Keypup MCP measures the time zone tax, from the hour a review request is sent to the teams that review locally and the cross-hub pull requests to hand off before logging off.
In a typical enterprise, a pull request sent to another team's repository waits 3.8 times longer for a first review, takes almost five working days to merge and is three times more likely to be abandoned. Learn what engineering leaders on Reddit say about cross-team contributions, and how Keypup MCP measures the inner source tax, from which owning teams are bottlenecks to which cross-team pull requests to unblock today.